
Knowledge Graphs
The world of data is messy – for anyone who has worked in this world long enough you know this to be true. But it’s not only messy due to bad data management (it doesn’t help), It’s also messy because the world is complex and full of rich and dynamic relationships. Relationships between data aren’t always obvious or permanent. So what if there was a way to represent this messy, complicated world of ours in a data structure? Enter the Knowledge Graph.
Knowledge graphs have been around for a number of years and have a lot of benefits as a means to represent complex data. The term “knowledge graph” gained prominence in 2012 when Google introduced its Knowledge Graph to enhance search engine capabilities, providing users with direct answers and richer search experiences. This development marked a pivotal moment, showcasing the practical utility of knowledge graphs in organizing and accessing vast amounts of complex data.
The basic notion of a knowledge graph includes nodes & edges
- Nodes: These represent entities or concepts, such as people, places, things, or events. For example, in a knowledge graph about movies, nodes might include “Inception,” “Christopher Nolan,” and “Leonardo DiCaprio.”
- Edges: These are the connections between nodes, representing relationships. In the same movie knowledge graph, edges would link “Inception” to “Christopher Nolan” with a “directed by” relationship, and to “Leonardo DiCaprio” with a “starred in” relationship.
This structure allows us to represent multiple complex relationships within the data by simply adding a new node and edge to the related entity.
Knowledge Graphs Have a Problem
Using knowledge graphs with your data comes with its own set of advantages and challenges. One major challenge is that populating and maintaining knowledge graphs can be quite difficult. The complexity of the problem space means that creating and filling these graphs often demands a significant amount of time and expertise. Expert domain knowledge is essential to accurately map entities and relationships, and ongoing effort is required to keep these relationships up-to-date. Additionally, knowledge graphs are not ideally suited for extensive unstructured data, as the reasons mentioned above contribute to the substantial time commitment needed to turn such data into a functional graph.
However, valuable context often lies “between the lines,” and it is this context that we will focus on today. By leveraging the latest AI advancements with large language models, we can extract context and meaning from unstructured data and transform it into a knowledge graph.
Using AI to Build our Graph
Large language models enable us to swiftly distil unstructured text into summarized content, extracting meaning, context, and relationships that would otherwise require hours of reading and analysis. We will leverage this capability to automatically extract data and build a knowledge graph. Now, let’s quickly review the components we will use to achieve this.
Components
- Neo4j – Neo4j is a high-performance graph database management system. It leverages the Cypher query language for efficient querying and manipulation, making it ideal for applications requiring complex data relationships, such as recommendation engines, fraud detection, social networks, and IT infrastructure management.
- youtube-transcript-api – Python library that retrieves transcripts or subtitles for YouTube videos, including automatically generated subtitles. It supports multiple languages and subtitle translation without requiring a headless browser. The API can be used programmatically or via a command-line interface, offering features such as batch fetching, formatting options, and proxy support.
- LLMGraphTransformer – NOTE: Still an experimental feature. The
LLMGraphTransformerfrom LangChain is a tool that converts documents into graph-based formats using a large language model (LLM). It allows users to specify node and relationship types, applying constraints and filtering as needed. The transformer can process documents asynchronously and supports structured outputs based on the provided schema and constraints, making it ideal for transforming text data into structured graph data for various applications.
We are using the LangChain framework for other elements such as LLM definition and app development. Without any more, let’s get into the code.
Build Graph of Smartwatch Comparisons
To give our example some real world context, I was recently looking to change my watch and was looking to upgrade to a Garmin. Garmin are notorious for having a lot of options so I’ve spent more than a few hours scouring YouTube, watching reviews and comparing features.
Setup Neo4J with APOC
The very first thing we need is a Neo4j server. There are multiple options on their site, for simplicity I chose the docker option. An important step missing for our use case is the installation of the APOC plugin. APOC is an addon that provides hundreds of procedures and functions adding a lot of useful functionality.
Before you can run the server you must download the latest APOC jar and save it to your $PWD/plugins directory, otherwise you will get errors when trying to initialise the Python client. Here I’ve linked to correct download for v4.4.35.
Run the following docker command to get the latest image & enable the plugin at the same time. Here we are simply enabling the plugin option in our instance and selecting the APOC plugin for installation.
docker run `
    -p 7474:7474 -p 7687:7687 `
    -v ${PWD}/data:/data -v ${PWD}/plugins:/plugins `
    --name neo4j-apoc `
    -e NEO4J_apoc_export_file_enabled=true `
    -e NEO4J_apoc_import_file_enabled=true `
    -e NEO4J_apoc_import_file_use__neo4j__config=true `
    -e NEO4JLABS_PLUGINS='["apoc"]' `
    -e NEO4J_dbms_security_procedures_unrestricted="apoc.*" `
    neo4j:4.4.34
NOTE: At the time of writing the latest version was throwing errors when trying to use APOC
Once docker has completed and the container is online navigate to http://localhost:7474/browser. When prompted for credentials type neo4j/neo4j and set your new password on the next screen. Take note of these credentials.
Test Neo4j Connection
To confirm we have a working connection, let’s switch over to VSCode and start writing our script. You’ll need the following dependencies:
langchain langchain-experimental neo4j json-repair langchain-openai youtube-transcript-api
Create a new app.py file in the solution and add the following code to it. This will simply test that the connection and credentials all work with our docker based Neo4j instance.
import os
from langchain_community.graphs import Neo4jGraph

os.environ["NEO4J_URI"] = "bolt://localhost:7687"
os.environ["NEO4J_USERNAME"] = "neo4j"
os.environ["NEO4J_PASSWORD"] = "buildkg123!"

def build_kg():
    graph = Neo4jGraph()

if __name__ == "__main__":
    build_kg()
All going well the script should execute, having successfully connected to your Neo4j instance.
Extract YouTube Transcripts
Next we will extract multiple transcripts for a selection of YouTube videos which review Garmin smart watches. For this we need to extract the transcript & convert it into a textual format to optimise the number of tokens we sent to OpenAI.
def extract_transcript():
    t = yt.get_transcripts(
        [
            "wYJfVczBORQ",
            "H-lDmNcKZtI",
            "YGXNYjL1t00",
            "sY0iHU71k-4",
            "BZ1k_bvupVc"
            ]
        )
    text = extract_text_elements(t)
    return text

def extract_text_elements(transcript_tuple):
    transcript_json, _ = transcript_tuple  # Unpack the tuple
    text_elements = []
    for key, segments in transcript_json.items():
        for segment in segments:
            text_elements.append(segment['text'])
    return ' '.join(text_elements)
Generate Graph Documents
Lastly we will convert the unstructured transcription text into a series of graph documents which are then written to our Neo4j instance. Here we limit the allowed nodes & relationships to what we want. This helps to control the spread of the graph.
def convert_text_to_graph(unstructured_text, llm, graph):
    graph_transformer = LLMGraphTransformer(
        llm=llm,
        allowed_nodes=["Product", "Feature"],
        allowed_relationships=["HAS_FEATURE", "UPGRADE_FROM"]
    )
    documents = [Document(page_content=unstructured_text)]
    graph_docs = graph_transformer.convert_to_graph_documents(documents)

    # Write to the Neo4j graph
    graph.add_graph_documents(graph_docs)
View the Graph
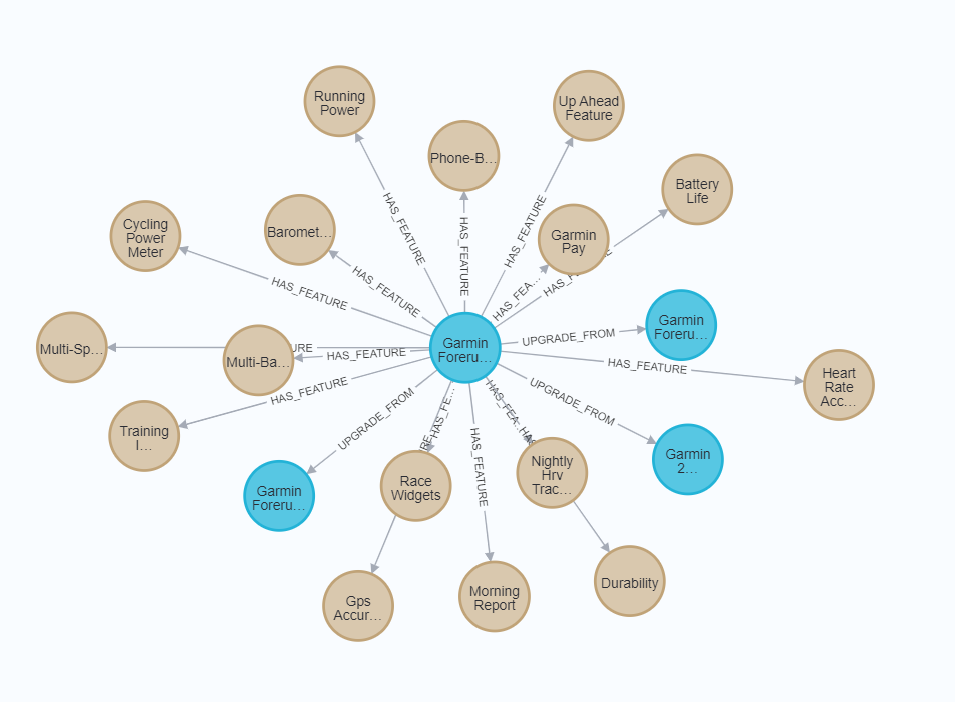
With all steps completed you can now run the following query against the database to see the full graph.
MATCH (n)-[r]->(m) RETURN n, r, m
Refine the Graph
If you look at the above graph you may not be that impressed. What it delivers is very uni-directional relationship. This isn’t exactly helpful when we want to run a comparison between different watches. To achieve this we can also pass a prompt to the graph transformer. This allows us to guide the LLM towards highlighting the type of relationships we want.
def convert_text_to_graph(unstructured_text, llm, graph):

    template = ChatPromptTemplate.from_messages([
    ("system", "You are a running watch expert. Your task today is to identify the various watches in the provided text and compare their features. When more than one feature is available on a watch ensure you make that connection")
])

    graph_transformer = LLMGraphTransformer(
        llm=llm,
        allowed_nodes=["Product", "Feature"],
        allowed_relationships=["HAS_FEATURE", "UPGRADE_FROM"],
        prompt=template
    )
    documents = [Document(page_content=unstructured_text)]
    graph_docs = graph_transformer.convert_to_graph_documents(documents)

    # # Write to the Neo4j graph
    graph.add_graph_documents(graph_docs)
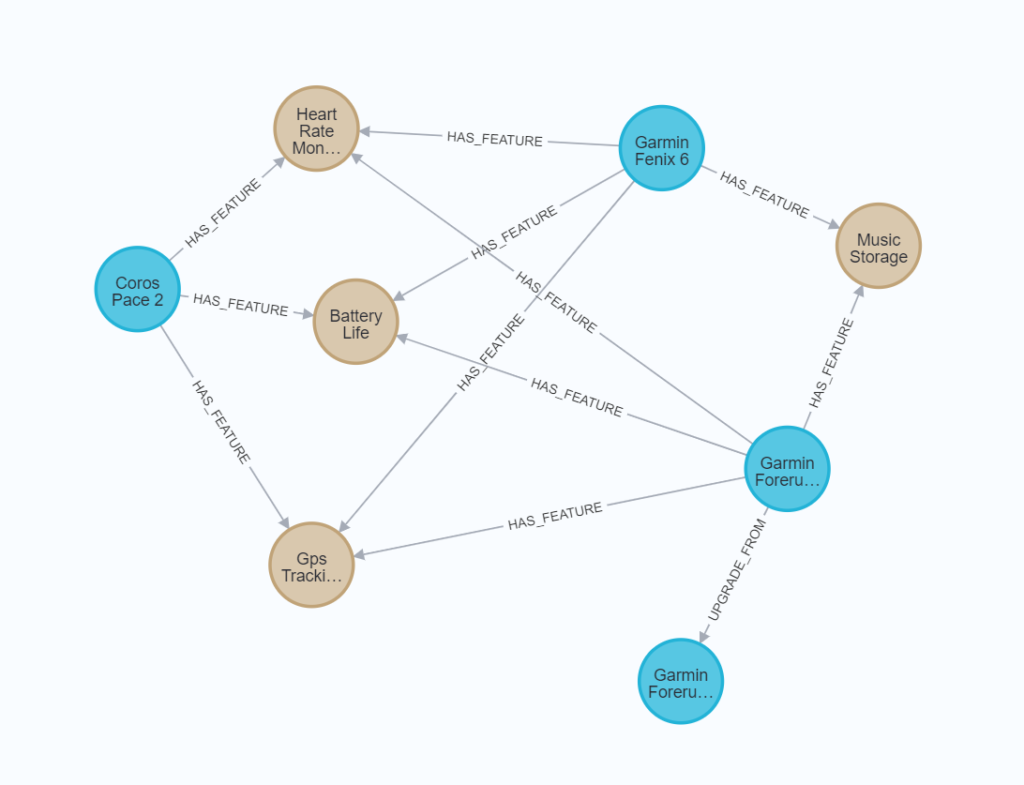
Now if we view the graph again we see a smaller but more connected graph
Limitations
For those who follow me, you know I’m a big fan of local, open-source models (see Mastering RAG, Using Ollama with Open Source Model & Unleash Ollama on Windows). I experimented with a local version of Llama3 running on Ollama, and the results were disappointing. When constructing a graph, context understanding is crucial. Therefore, it’s essential to choose a model that excels in extracting context and meaning from a text.
Additionally, the results are not idempotent, which can cause issues if you plan to implement this in a production system. While I liked the idea of using this method to get started and form the initial backbone of your graph, it’s important to remember that AI alone cannot stand up, populate, and maintain your knowledge graph. Keeping this in mind will help manage your expectations.
Conclusion
Gartner has recently highlighted knowledge bases as a technology to watch, predicting that within the next 1-3 years, they will become more ubiquitous in our tech stacks. I personally agree with this outlook. Given the diminishing data problem and the increasing role of AI in our economy, I foresee expert knowledge graphs becoming a crucial backbone in the industry. The ability to identify relationships and manage their complexity will be invaluable to these evolving expert systems. I envision a future where agents have a limited set of knowledge encapsulated in a graph.
Currently, I see the most value in building smaller, focused graphs that serve specific domains. This approach allows us to mitigate some of the complexities associated with knowledge graphs while still reaping the benefits on a smaller scale.
What we have discussed today is an excellent example of using AI to accelerate the creation of our own knowledge graphs. In fact, here’s another one I built from the content of this article. Happy coding!
All code for this tutorial is available on Github .
If you liked this work consider supporting me by subscribing to my newsletter or if you think I deserve it
[…] knowledge of LLMs beyond their original training data and defend against hallucinations. Later, in Building Knowledge Graphs, the focus was put on the concept of a knowledge graph and how we can use LLMs to overcome one of […]